I'm a 5th-year Ph.D. student in Computer Science and Informatics at Emory, fortunate to be advised by Dr. Emily Wall and to work closely with Dr. Cindy Xiong Bearfield.
I'm a visualization researcher exploring how human/visualization design factors shape visualization interpretations through the lens of confirmation bias. My works combine both quantitative and qualitative methods to understand how individuals reason with visual data.
Specifically, I look into three questions:
How to elicit attitudes and beliefs more accurately and expressively?
How to identify confirmation bias in both static and interactive visualization?
Which types of interventions could we employ to mitigate biases?
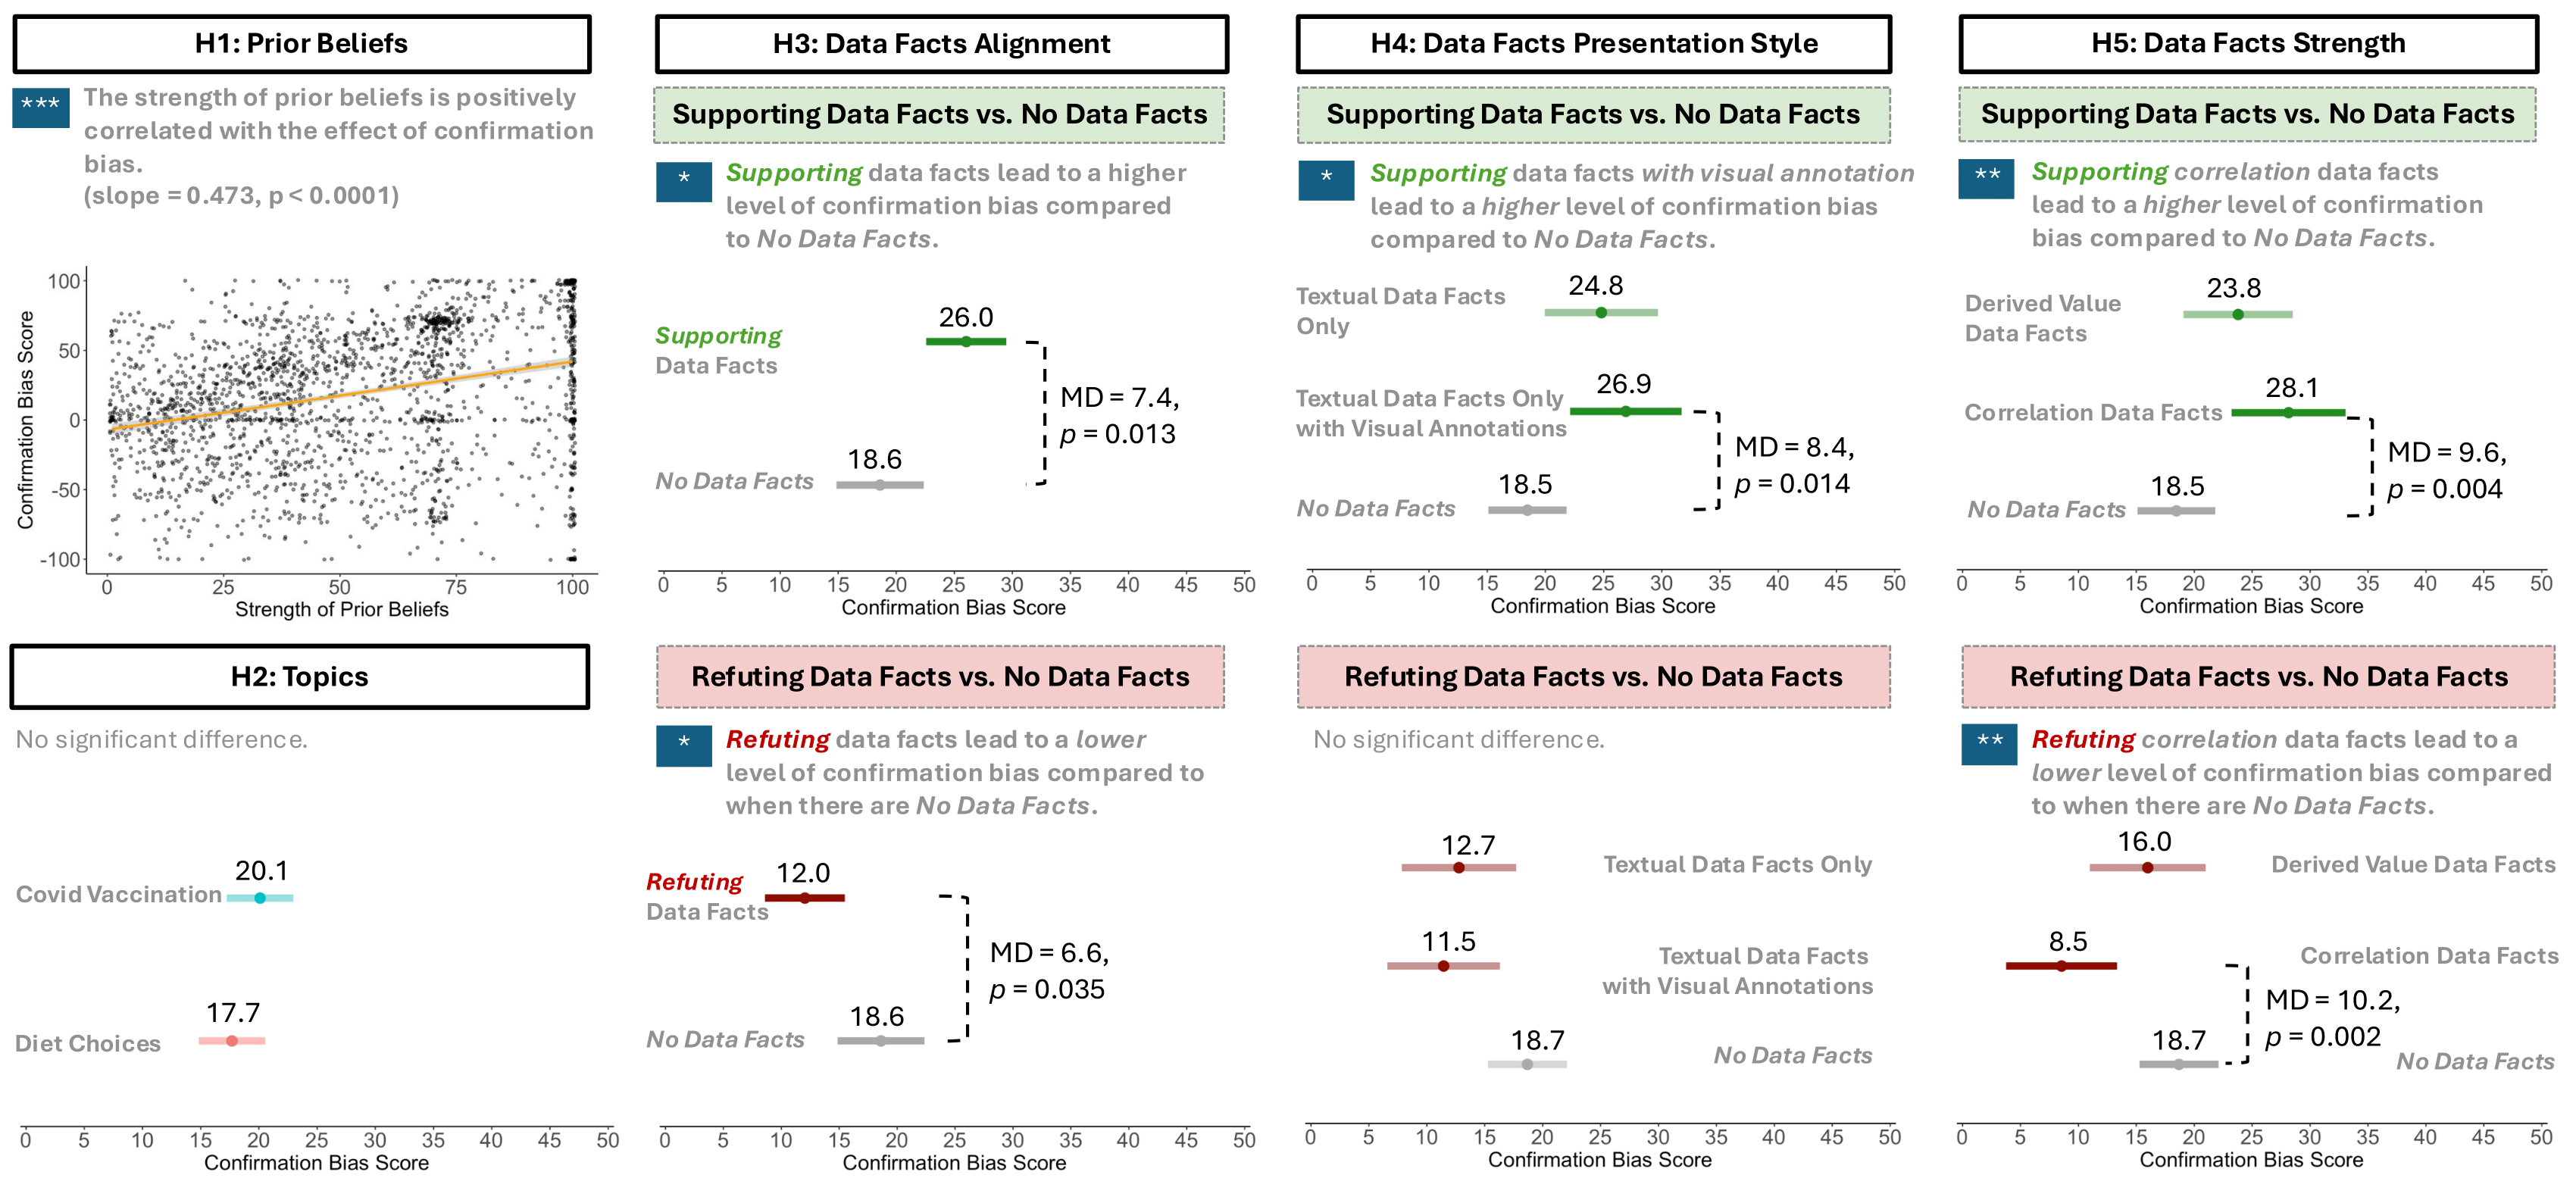
Impacts of Data Facts on Confirmation Bias in Visual Data Reasoning
In this project, we conducted a
series of crowdsourced experiments to explore the biasing effects of data facts. Our findings show that the presentation style, strength,
and alignment of data facts with pre-existing beliefs significantly impact confirmation bias. Data facts that support prior beliefs can
exacerbate confirmation bias, whereas those that refute those beliefs can mitigate it. This effect is amplified when the data facts are
used in combination with visual annotations. Data facts describing variable correlations are perceived to be more compelling than
ones describing average values and are associated with higher levels of confirmation bias. Paper
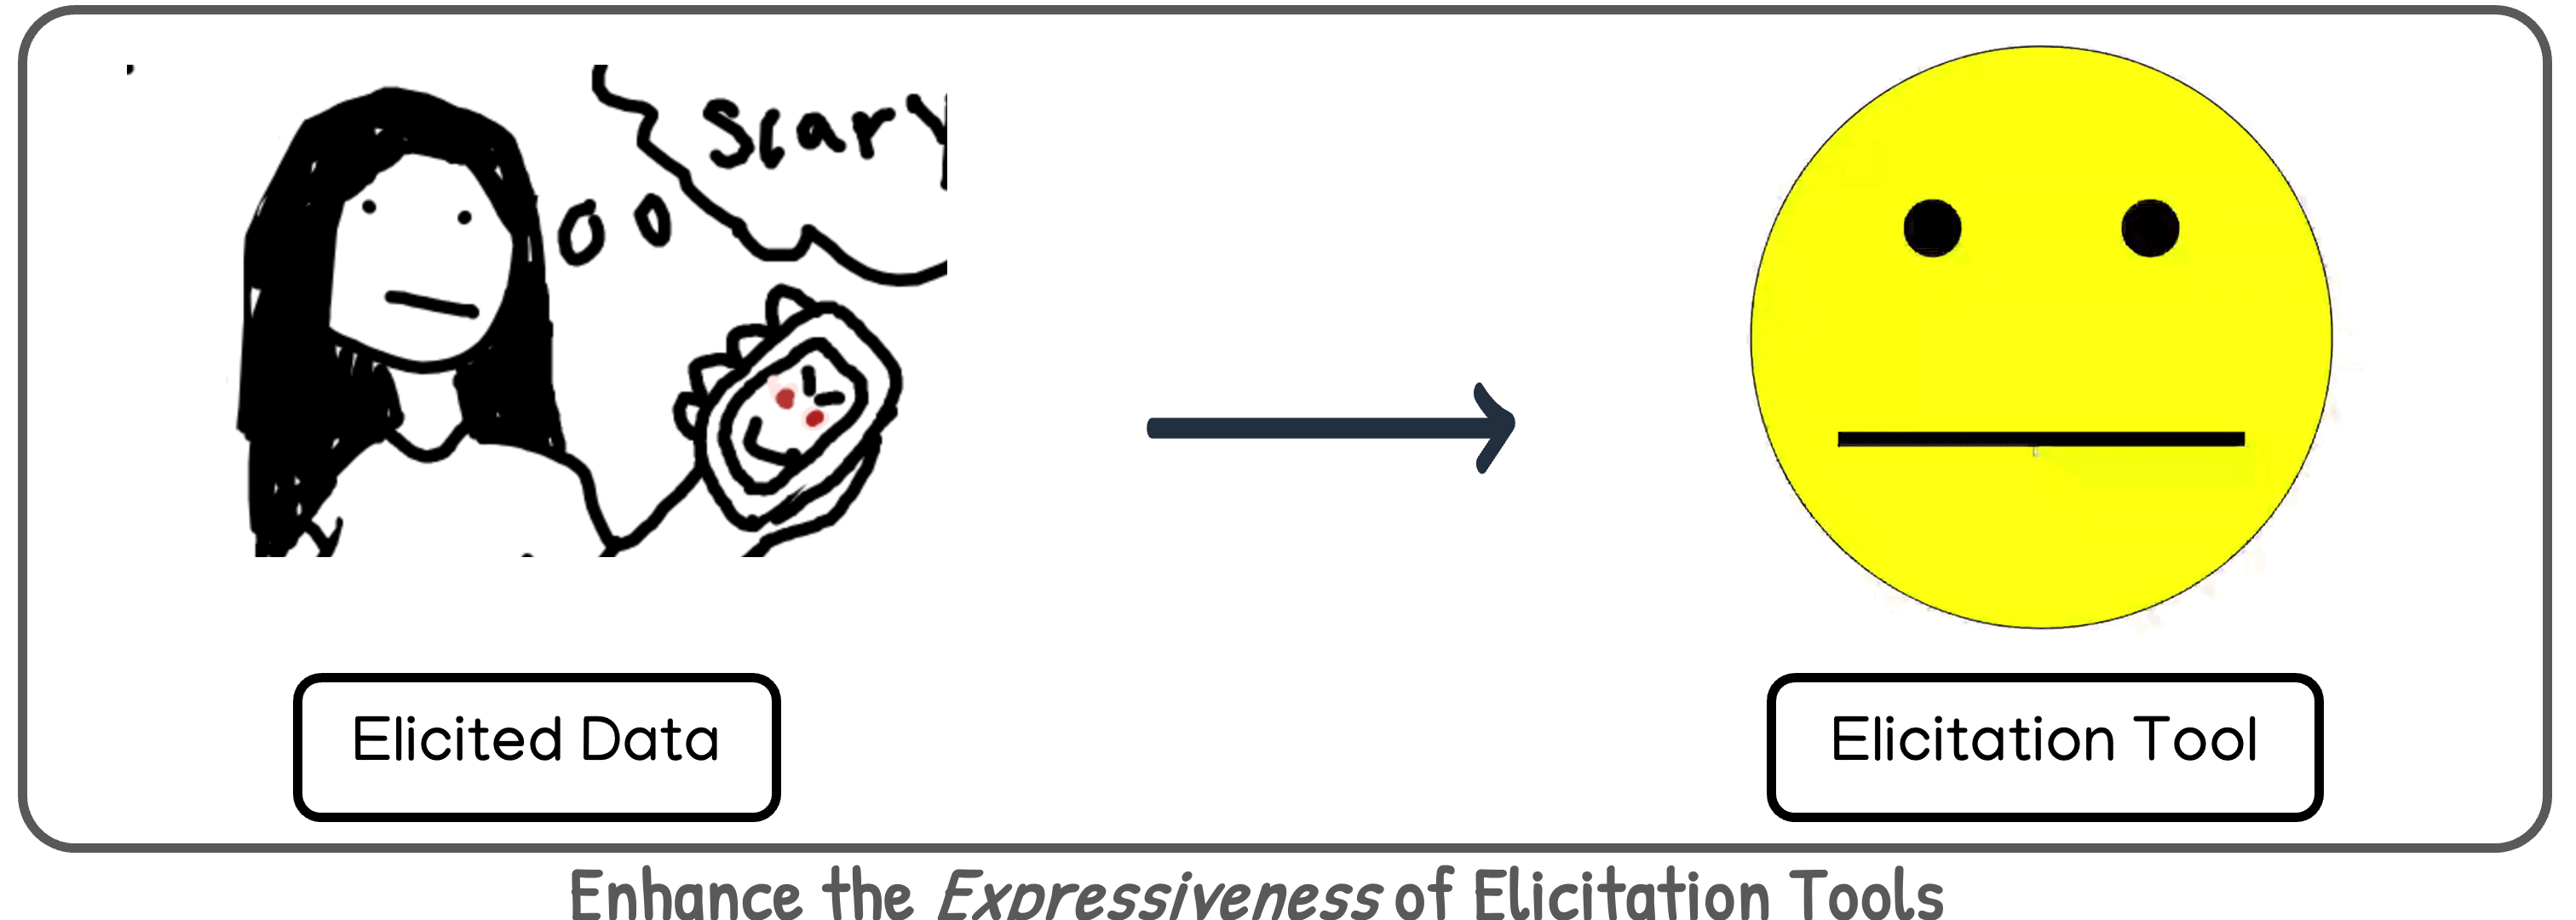
Enhance the Expressiveness of Elicitation Tools through Visual Representations.
In this project, we explore visual and textual representations of beliefs and attitudes
through a two-round qualitative study (N = 41) and investigate
their potential to enhance the expressiveness of elicited data.
Participants expressed their attitudes and beliefs (i) visually,
through hand-drawn sketches, and (ii) verbally, through text. We
identified five key elements in the sketches: emotions, directional
attitudes, structural beliefs, uncertainty, and topics, and analyzed
how these elements interact, using the textual elicitations to
disambiguate sketches.
Paper
Visualization Designs
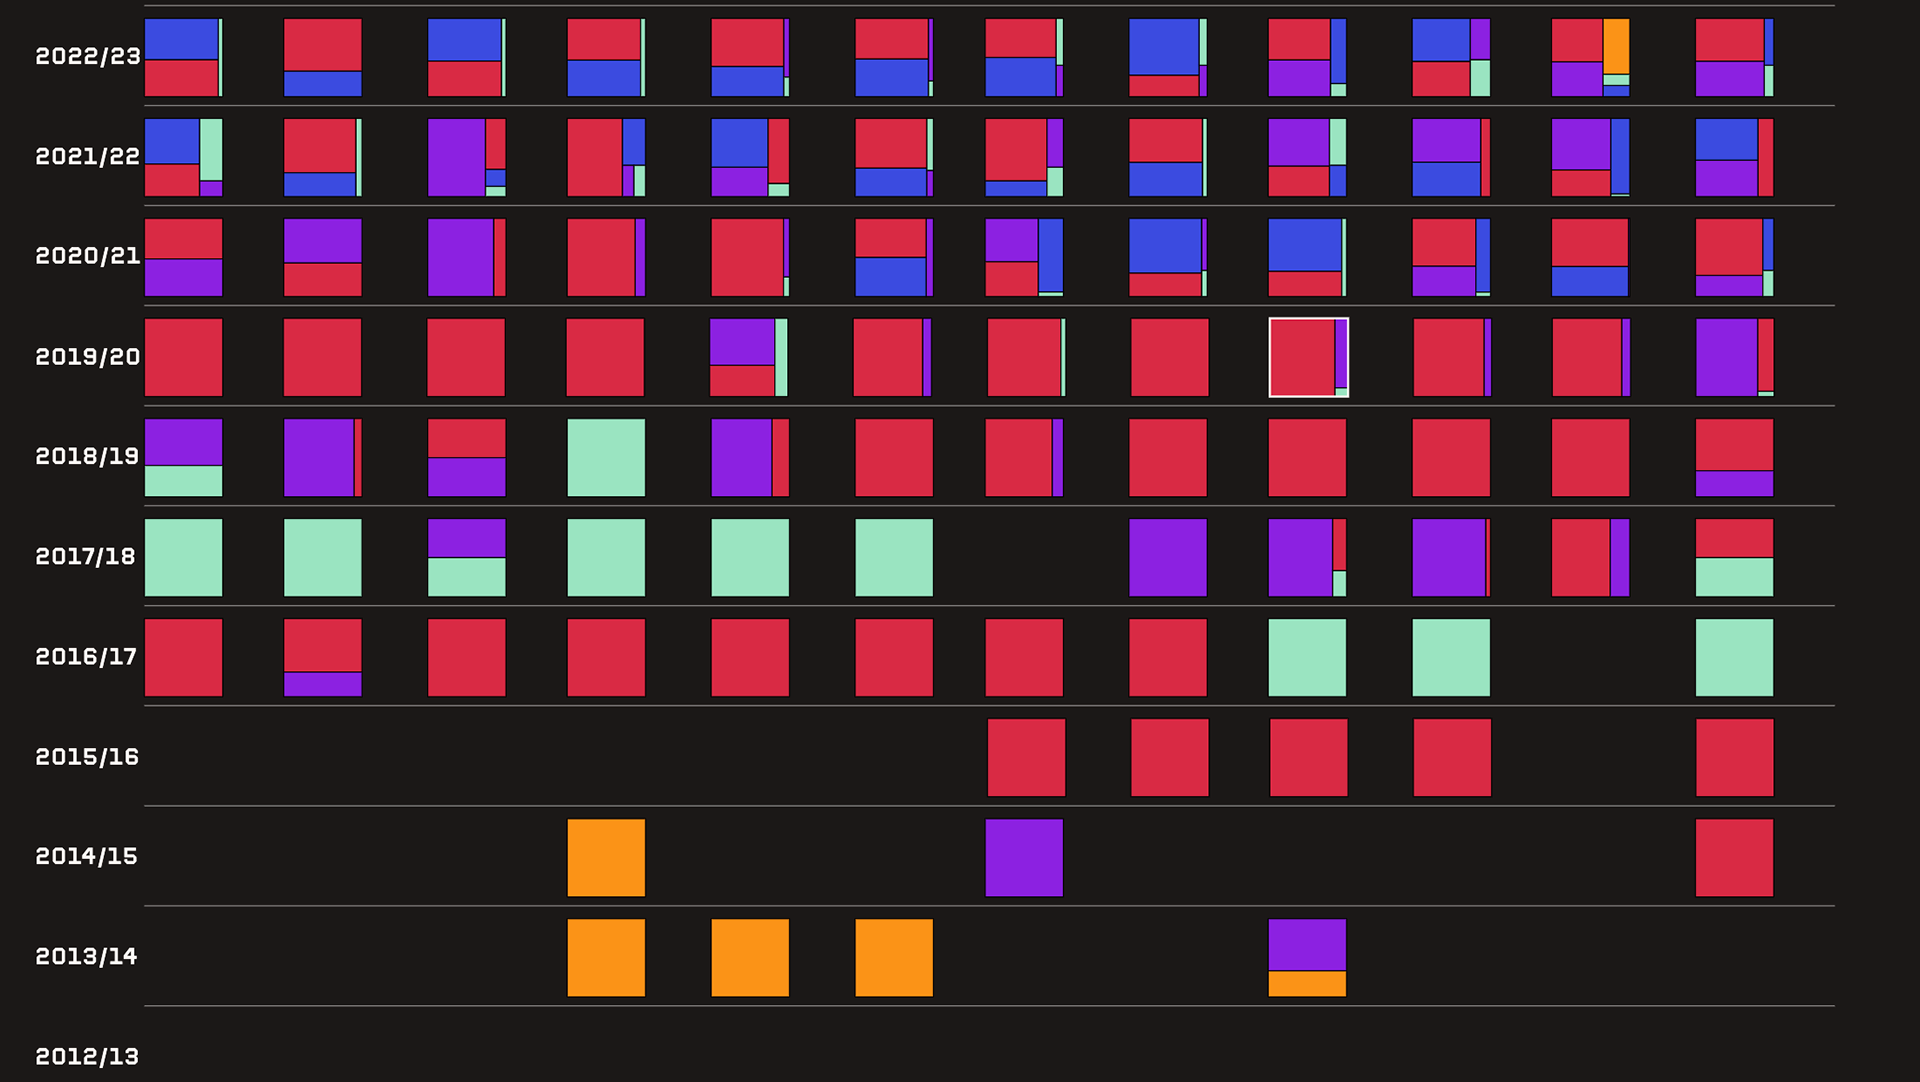
Apart from my research, I also enjoy prototyping "unconventional" visualization for the project Data by Design - a digital book chronicling the history of data visualization.
Visualizing Resistance in Slave Trade Voyages An earlier implementation.Visualizing Hidden Labor Behind the Creation of the Website.
Publications
Does a Picture Paint a Thousand Words? Using Visual and Textual Channels to Understand Attitudes and Beliefs Shiyao Li, Roshini Deva, Arpit Narechania, Alireza Karduni, Cindy Xiong Bearfield, Emily Wall Proceedings of the SIGCHI Conference on Human Factors in Computing Systems (CHI), 2026
PDF
Confirmation Bias: The Double-Edged Sword of Data Facts in Visual Data Communication Shiyao Li, Thomas Davidson, Cindy Xiong Bearfield, Emily Wall Proceedings of the SIGCHI Conference on Human Factors in Computing Systems (CHI), 2025
PDF
What Data Does and Does Not Represent: Visualizing the Archive of Slavery Shiyao Li, Margy Adams, Tanvi Sharma, Jay Varner, Lauren Klein IEEE Computer Graphics and Applications, 2025
PDF
Adapting Educational Technologies across Learner Populations: A Usability Study with Adolescents on the Autism Spectrum
Xiaoman Zi, Shiyao Li, Roxanne Rashedi, Marian Rushdy, Ben Lane, Shitanshu Mishra, Gautam Biswas et al. 42nd Annual Meeting of the Cognitive Science Society, 2020.
PDF
Characterizing datasets for social visual question answering, and the new TinySocial dataset
Zhanwen Chen, Shiyao Li, Roxanne Rashedi, Xiaoman Zi, Morgan Elrod-Erickson, Bryan Hollis, Angela Maliakal, Xinyu Shen, Simeng Zhao, and Maithilee Kunda. Joint IEEE 10th International Conference on Development and Learning and Epigenetic Robotics (ICDL-EpiRob), 2020.
PDF